Scope 3 categories are no longer a peripheral concern for Philippine issuers preparing for PFRS S2. The Philippine SEC’s adoption of PFRS S1 and S2, formalized through Memorandum Circular No. 16, Series of 2025, mirrors the ISSB’s IFRS S2 climate disclosure requirements. While first-time reporters are granted a two-year deferral on scope 3 emissions reporting, this transitional relief is designed to support preparation, not to postpone it indefinitely.
This guide outlines the 15 scope 3 emissions categories, distinguishes upstream from downstream activities, and examines which categories tend to carry the most weight across different sectors in the Philippines.
What are scope 3 emissions categories?
Scope 3 emissions categories are the standardized groupings the GHG Protocol uses to organize indirect emissions across a company’s value chain. Defined under the GHG Protocol’s Corporate Value Chain (Scope 3) Standard, these categories cover activities a company does not own or control directly, such as supplier production, business travel, and product use after sale. The categories are designed to be mutually exclusive, so no single emission source is counted twice across a company’s inventory.
Unlike scopes 1 and 2, which capture direct emissions and purchased energy respectively, scope 3 spans activity across suppliers, logistics providers, franchisees, and customers. Scope 3 emissions often account for more than 90% of a company’s total carbon footprint, outweighing scopes 1 and 2 emissions combined. This makes it the category with the greatest influence on a company’s overall carbon footprint.
Under PFRS S2, companies are expected to screen all scope 3 categories for materiality, even before the two-year deferral is lifted. This groundwork determines which categories require full measurement, which can rely on estimates, and which fall outside a company’s material boundary altogether.
What are upstream and downstream emissions?
Scope 3 emissions are grouped into two broad categories: upstream and downstream. Upstream emissions occur during the production of goods or services that a business purchases or uses, covering everything that happens before a product reaches the reporting company. Downstream emissions, by contrast, cover value chain activity that occurs after a product leaves the company, from distribution to the customer’s use and eventual disposal.
This means the same emission source can be upstream for one company and downstream for another. A supplier’s downstream distribution emissions, for instance, register as upstream transportation emissions for the buyer who purchases from them.
What are the 15 scope 3 categories?
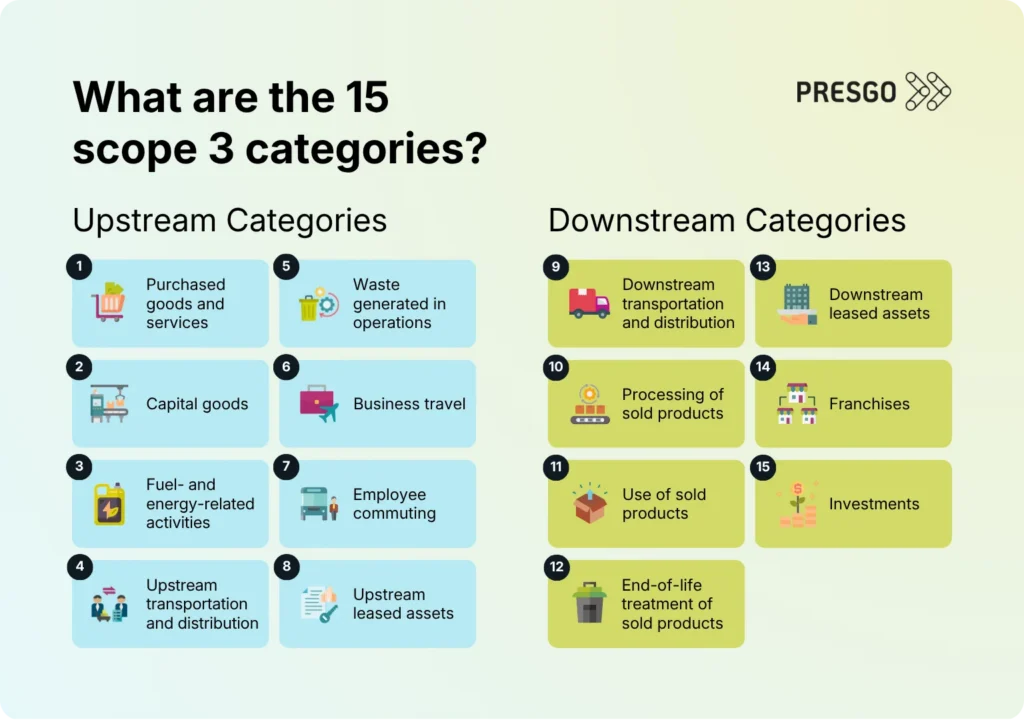
Under the GHG Protocol framework, Categories 1 to 8 are upstream activities, covering suppliers and inputs, while Categories 9 through 15 are downstream activities, covering sold products and investments. This structure gives companies a consistent, auditable way to organize the different types of value chain emissions they are responsible for.
The GHG Protocol’s Corporate Value Chain (Scope 3) Standard organizes scope 3 emissions into 15 categories, split evenly between value chain inputs and outputs.
Upstream categories
- Purchased goods and services: Emissions from producing all goods and services the company procures. Examples are emissions from raw materials, packaging, or third-party software subscriptions.
- Capital goods: Emissions embedded in long-term assets such as equipment, buildings, and machinery. For example, constructing a new manufacturing plant or purchasing delivery vehicles.
- Fuel- and energy-related activities: Emissions from producing fuel and energy not already captured in scope 1 or scope 2. For example, upstream emissions from extracting and refining the diesel a company burns in its own vehicles.
- Upstream transportation and distribution: Emissions from transporting purchased goods from suppliers to the company. For example, freight shipping from a supplier’s factory to a company’s warehouse.
- Waste generated in operations: Emissions from third-party disposal and treatment of the company’s operational waste. An example would be landfill or incineration emissions from office and facility waste collected by an outside vendor.
- Business travel: Emissions from employee travel in vehicles the company does not own or operate. These include flights, train travel, or rental cars for client meetings and conferences.
- Employee travel: Emissions from employees traveling between home and work, including staff driving personal vehicles or taking public transit to the office.
- Upstream leased assets: Emissions from assets the company leases but does not own. For example, a leased office space or a rented warehouse facility.
Downstream categories
- Downstream transportation and distribution: Emissions from transporting sold products to end customers. For example, last-mile delivery from a distribution center to a retail store or customer’s door.
- Processing of sold products: Emissions generated when a company’s products are further processed by another business before reaching the end user. A raw steel producer’s product being processed into car parts by a manufacturer can fall under this emission category.
- Use of sold products: Emissions from customers using the company’s products over their expected lifetime. For example, the electricity a household appliance consumes over years of use.
- End-of-life treatment of sold products: Emissions from disposing of or recycling products once customers are finished with them. An example would be a discarded electronic device processed at a recycling facility.
- Downstream leased assets: Emissions from assets the company owns but leases out to others. For example, a landlord’s leased commercial property, with emissions attributed to the tenant’s operations.
- Franchises: Emissions from the operations of franchisees, like the energy use and operations at individually owned locations under a franchise brand.
- Investments: Emissions associated with a company’s investments, loans, and financial holdings, sometimes called financed emissions. These include a bank’s emissions exposure through its loan portfolio to high-emitting industries.
Not every category applies with equal weight to every business, a distinction covered further below.
How to Decide Which Scope 3 Categories to Measure and Report
Screening all 15 categories does not mean measuring all with equal precision. The GHG Protocol recommends identifying categories likely to represent a meaningful share of total scope 3 emissions based on a company’s business model and industry, rather than attempting a uniform, high-precision inventory across every category from the outset.
A practical starting point is a spend-based screening exercise: estimating emissions across all 15 categories using spend data and industry-average emission factors. This produces a rough first footprint that reveals which categories are significant enough to warrant more granular measurement. Categories that surface as immaterial can be documented with a brief rationale rather than fully quantified, which satisfies the screening requirement without the cost of a full inventory.
Materiality is not purely a function of emissions volume, either. A category with a comparatively small emissions footprint may still be material if it carries reputational risk, investor scrutiny, or regulatory attention specific to the company’s sector. Categories tied to supplier labor practices or product end-of-life, for example, sometimes warrant closer reporting even when their tonnage is modest relative to other categories.
In most cases, three to five categories dominate a company’s total scope 3 footprint, which is why a screening step before deep measurement saves considerable time and resourcing. Under PFRS S2, this screening process also doubles as the documentation trail companies will need to justify excluded or estimated categories once scope 3 assurance requirements take effect.
Which categories matter most to different sectors?
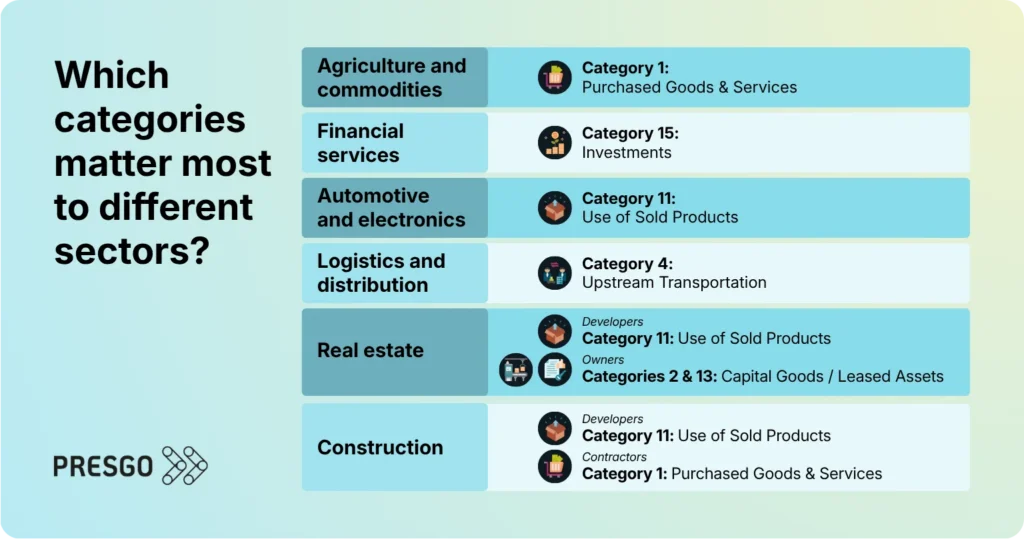
Category dominance varies sharply by industry, since it follows the balance of goods purchased, products sold, and services provided.
- Agriculture and commodities: Category 1 (purchased goods and services) is typically the largest, comprising as much as 63% of total scopes 1-3 emissions for companies in agricultural commodities, driven largely by upstream feed and fertilizer production. Category 10 (processing of sold products) and category 11 (use of sold products) are also relevant for this sector, capturing emissions from food processing, packaging, storage, and cooking further down the value chain. However, they are reported less consistently across the sector.
- Financial services: Category 15 (investments) dominates for financial institutions, comprising over 99% of total scope 3 and total scopes 1 to 3 emissions reported by the sector. Portfolio emissions from lending, investment, and underwriting activities run on average more than 700 times larger than a financial institution’s own direct emissions. Locally, Ayala Corporation’s scope 3 emissions accounted for 97.1% of its total 2024 footprint, driven largely by coal consumption tied to its investment portfolio.
- Automotive and consumer electronics: Category 11 (use of sold products) dominates, comprising as much as 91% of total scope 3 emissions for capital goods manufacturers and 86% for transport equipment manufacturers, driven by the energy customers consume operating these products over their lifetime. Category 1 (purchased goods and services) is typically the secondary category for both, though a much smaller share by comparison.
- Logistics and distribution: Category 4 (upstream transportation) is typically the largest category for transport services companies, comprising as much as 32% of total scope 3 emissions. Category 3 (fuel- and energy-related activities) and category 1 (purchased goods and services) round out the remaining upstream fuel extraction and vehicle production emissions.
- Real estate: Category dominance varies by activity. For building developers, category 11 (use of sold products) is the largest, accounting for roughly half of total scope 3 emissions from the expected operational emissions of sold buildings. For building owners, category 2 (capital goods) and category 13 (downstream leased assets) tend to dominate instead, while REITs that finance rather than own real estate should treat category 15 (investments) as most relevant. Ayala Land has reported that around 80% of its total emissions stem from its supply chain, particularly construction materials like steel, cement, and PVC, illustrating just how much category 1 and category 2 can weigh on a developer’s footprint.
- Construction: Category 11 (use of sold products) is the largest for building developers, accounting for roughly half of total scope 3 emissions from expected building operations. Category 1 (purchased goods and services) is the more relevant category for construction contractors, covering upstream construction materials.
For Philippine issuers preparing PFRS S2 disclosures, sector context is a useful shortcut, but not a substitute for the company-specific screening exercise above. The categories a peer company reports as material will not always translate directly to another business, even within the same sector, particularly where supply chains or business models differ.
Simplify Scope 3 Category Screening for PFRS S2 with Presgo

PFRS S2 gives Philippine issuers a two-year runway before scope 3 emissions reporting becomes mandatory, but the categories a company will eventually report do not change during that window. Understanding the 15 scope 3 categories, distinguishing upstream from downstream activities, and running an early materiality screen put companies ahead of the assurance requirements that follow.
Manually screening 15 scope 3 categories across a growing supplier base is not sustainable at scale. Presgo is an AI-ready ESG reporting platform built to help regulated companies across Southeast Asia keep pace with evolving disclosure requirements. It helps Philippine issuers automate materiality assessment and scope 3 data collection, so PFRS S2-ready disclosures are in place well ahead of the assurance deadline.
Get ahead of PFRS S2 and scope 3 emissions reporting – book a demo today!
FAQs
- Do I have to report all 15 scope 3 emissions categories?
No. Companies are expected to screen all 15 categories for materiality but only report in detail on those found to be material to their operations. Immaterial categories can be excluded with a documented rationale.
- Which scope 3 category is typically the largest?
It depends on the sector. Category 1 (purchased goods and services) tends to dominate for most industries, though category 11 (use of sold products) leads for automotive and consumer electronics, and category 15 (investments) leads for financial institutions.
- Can the same emission appear in two categories?
No. The GHG Protocol’s scope 3 categories are designed to be mutually exclusive, so a single emission source should only be counted once in a company’s inventory.
- What’s the difference between primary and secondary data?
Primary data is actual emissions data collected directly from within a specific scope 3 category, such as a supplier’s reported emissions for category 1 or a logistics provider’s fuel data for category 4. Secondary data relies instead on industry averages or spend-based estimates, used when category-specific figures aren’t available. Companies generally start with secondary data to screen all 15 categories, then shift to primary data for the categories found to be material.