Talk to an ESG Expert about how Presgo can help you!
Our ESG Experts are on-hand to understand your ESG Reporting needs and cater our solution to you. Get in touch to discuss how we can help.
Talk to an ESG ExpertContents
- What are scope 3 emissions?
- Why is measuring scope 3 emissions important?
- What are scope 3 challenges and solutions in Singapore?
- How to Calculate Scope 3 Emissions
- FAQs on Scope 3 Emissions in Singapore
- Close the Scope 3 Gap with Presgo ESG Technology
Starting FY 2025, all SGX-listed companies are now required to disclose scope 1 and scope 2 emissions under ISSB-aligned standards. Straits Times Index (STI) constituents, the exchange’s 30 largest companies by market capitalisation, move further ahead by adding scope 3 emissions reporting from FY 2026. Non-STI companies’ scope 3 reporting remains voluntary, although their other ISSB-based climate disclosures phase in from FY 2028 and FY 2030.
Given the phased timeline and familiarity with reporting scopes 1 and 2 emissions, adding scope 3 may appear straightforward. But scope 3 emissions typically live in supplier invoices and on factory floors a company has no control over. Most Singapore companies don’t have that data sitting close by and easily available, which is why the supplier data problem persists.
In this guide, explore the challenges in reporting scope 3 emissions and supplier data and how ESG reporting software can help in measuring, managing, and reporting.
What are scope 3 emissions?
Scope 3 emissions are all indirect greenhouse gas (GHG) emissions tied to a company’s value chain, upstream and downstream, that fall outside its operations and purchased energy. On average, scope 3 accounts for around 88% of a company’s total carbon footprint, according to Deloitte. A 2026 climate report published by SGX Group found that only 37% of the 499 SGX-listed issuers reported their scope 3 emissions at all in 2025. This is compared to 87% for scope 1 and 93% for scope 2.
The GHG Protocol splits scope 3 into 15 categories:
Upstream
Upstream emissions cover the supply chain feeding into a company’s operations.
- Purchased goods and services
- Capital goods
- Fuel- and energy-related activities (not in scope 1 or 2)
- Upstream transportation and distribution
- Waste generated in operations
- Business travel
- Employee commuting
- Upstream leased assets
Downstream
Downstream emissions cover what happens after a product or service leaves the company.
- Downstream transportation and distribution
- Processing of sold products
- Use of sold products
- End-of-life treatment of sold products
- Downstream leased assets
- Franchises
- Investments/financed emissions
ST Engineering, for example, disclosed emissions from its equipment and operations (scope 1) and air-conditioning systems (scope 2). For scope 3, the technology group reported these emissions: category 5 for waste generated from operations, category 6 for business travel, and category 7 for employee commute. These three categories are examples of upstream scope 3 emissions.
Why is measuring scope 3 emissions important?
Scope 3 emissions are heavily underreported. The scope only recently became a mandatory part of ESG reporting for some, and most companies are still building the systems to measure it. These factors show the need for scope 3 reporting:
Accurate climate risk and impact
Scope 3 accounts for the majority of total emissions, and the numbers can climb much higher for financial services and retail. A company reporting only scope 1 and 2 emissions is disclosing a fraction of its footprint and missing the risks concentrated in its value chain. Measuring that gap is what turns a sustainability strategy into an accurate picture of where the risk actually sits.
Regulatory readiness
Currently, the updated phased timeline only requires STI-constituent companies to report scope 3 emissions under the International Sustainability Standards Board (ISSB) framework from FY 2026. Getting there takes more than one reporting cycle and needs working data pipelines with suppliers, tested methodologies, and internal review processes in place. Scope 3 data assembled under pressure produces unreliable numbers and ineffective disclosures.
Investor review and customer expectations
Investors assess climate risk using full value chain emissions instead of simply a company’s direct operational footprint. Consumer purchasing behaviour is also moving towards sustainable products for health and environmental reasons, which also benefit society.
Consumer demand is changing at the same time. A 2025 GlobeScan study found that environmentally friendly purchases in Singapore rose from 41% to 50% in a single year. Though this trend isn’t caused by companies’ scope 3 emissions directly, it increases the pressure on companies to support sustainability claims with verifiable data and to hold themselves accountable through compliant disclosures and practices.
Competitive positioning
A 2024 study by the Institute of Singapore Chartered Accountants and Schneider Electric showed Singapore companies’ understanding of scope 3 fell short. From more than 500 senior leader respondents, only 39% of leaders felt they had a strong grasp of what scope 3 is. Only 6% were fully conducting scope 3 measurements and analysis. This means that those who move forward quickly get a significant advantage in the market.
What are scope 3 challenges and solutions in Singapore?
Singapore companies were behind on regulatory compliance preparations for the mandate implementation in 2025. There are a handful of gaps in understanding why scope 3 emissions reporting and measurement are still challenging.
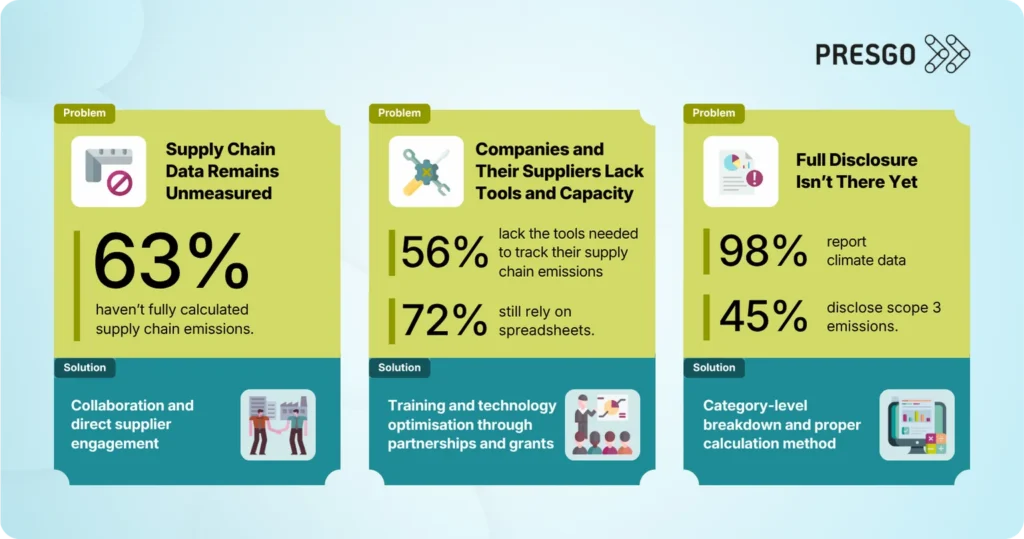
Supply chain data remains largely unmeasured
In a Schneider Electric study, 63% of Singapore companies had not fully calculated their supply chain data emissions. The expansive network of stakeholders outside of the direct line in operations and services can be overwhelming for data collection. Without that data, most scope 3 numbers become generic industry estimates instead of the company’s actual footprint.
Solution: Collaboration and Direct Supplier Engagement
A complex and overwhelming load of data sources can be solved by collaboration and supplier-specific engagement. For instance, Singtel is directly collaborating with Ericsson, Huawei, and Nokia, its three main 5G network suppliers, to address scope 3 emissions. They worked on quantifying their network infrastructure’s embodied carbon, including materials and construction sources. This strategy helped give a specific view of where reductions and improvements are possible.
Companies and their suppliers lack tools and capacity
Apart from the lack of complete and consistent data, only 44% of companies in the same study had the tools to systematise and manage their data and calculations. In a UiPath report, 72% of companies continue to rely on spreadsheets, while 55% still do manual entry. Smaller companies can be more dependent on these processes. With the lack of advanced technology and technical expertise to measure emissions, gaps will persist in supplier data.
Solution: Training and Technology Optimisation Through Partnerships and Grants
Building supplier capability is part of effective supply chain data management. Keppel exemplifies this by partnering with the UN Global Compact Network Singapore in providing carbon management training directly to its SME suppliers.
ESG reporting platforms are equipped with tools and expert guidance, available to optimise emissions calculations and data management and disclosure. These can seamlessly collect and analyse supplier data, detect irregularities, and draft disclosures, among other things. On the cost, there are several sustainability reporting grants offered in Singapore, including the government-funded Productivity Solutions Grant (PSG) for SMEs’ equipment and digital solutions support.
Full and detailed disclosure has not been achieved
According to an EY report, 98% of Singapore companies were already reporting climate-related data. While this data is a good start, only less than half (45%) were disclosing their scope 3 emissions. Most companies can pull their own utility bills for scope 1 and 2, but scope 3 requires going back to hundreds of suppliers for numbers that those suppliers might not be tracking themselves. The gap between simply reporting and the actual tracing of supplier emissions data is where most Singapore companies’ concerns currently exist.
Solution: Category-level Breakdown and Proper Calculation Method
ST Engineering’s category-level breakdown, covering categories 5, 6, and 7 as shown above, is what closing that gap looks like in practice. Companies can use that same structure, building out category by category as supply chain data becomes available, instead of combining all numbers. Each category is tracked and reported separately, whether it’s business travel, waste, or so on. That level of detail lets stakeholders and auditors trace the numbers to their sources.
How to Calculate Scope 3 Emissions
Every calculation method follows the general core formula of multiplying activity data and its emission factor. What changes in scope 3 emissions is the data source behind that multiplication, and the right method depends on the category and what data is realistically available.
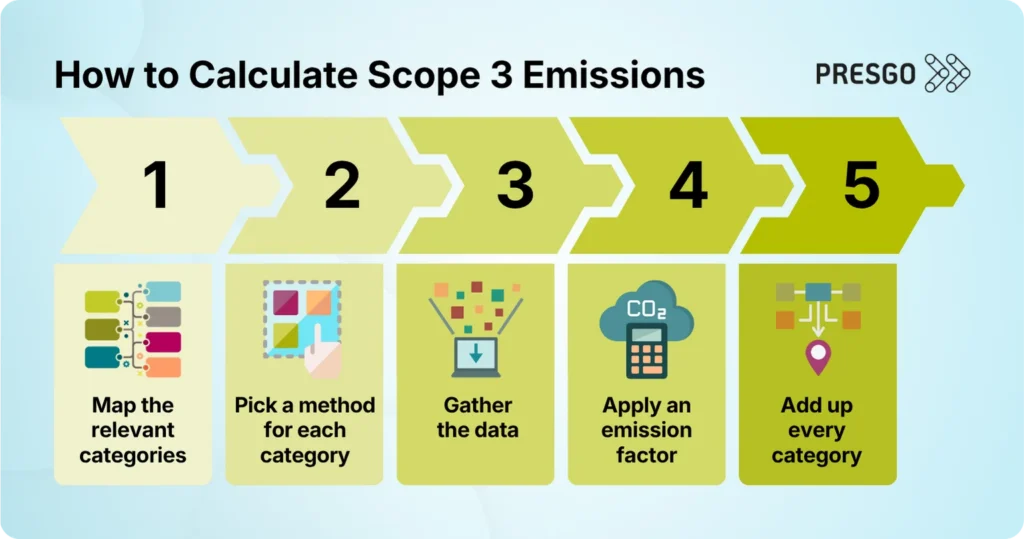
- Map the relevant categories: Not all the 15 GHG Protocol categories carry equal weight. Similar to ST Engineering’s strategy, most companies find that two or three drive the bulk of their footprint.
- Pick a method for each category: The calculation method depends on what data is available for that specific category, not a single approach applied across the whole inventory. The table below shows examples of several methods.
- Gather the data: This could mean transaction records, physical quantities like weight or distance, or figures reported directly by a supplier.
- Apply an emission factor: Multiply the data from step 3 by a factor suited to that category. Sources include the GHG Protocol’s own calculation and emission factor databases, as well as national registries like Singapore’s Emission Factors Registry (SEFR), launched by the Singapore Business Federation in 2024.
- Add up every category: The sum of each category’s emissions gives the full scope 3 figure.
The GHG Protocol recognises several calculation methods that fit different stages of a company’s supplier data.
| Method | Best Used For | Advantages | Disadvantages |
| Spend-based | Initial screening, category prioritisation, and filling data gaps | Quick to set up, uses existing financial records, and broad coverage | Less specific, affected by price and inflation, weak for tracking physical emissions reductions |
| Average data | Categories where quantities (e.g., kg, tonne-km) are available | More physically representative than spend-based and can use established emissions factors | Requires activity data, and emission factors may not reflect specific suppliers |
| Supplier-specific | Material suppliers and products where primary data is available | Most specific to actual supplier or product emissions, useful for supplier engagement and tracking reductions | Resource-intensive, and supplier data quality and boundaries may vary |
| Hybrid | Priority categories where some supplier data exists but still contain gaps | Balances specificity and practicality, fills missing primary data with secondary data | More complex, requires clear methodology and controls to avoid inconsistent treatment |
| Waste-type-specific | When waste is segregated and weighed by material and disposal method | Reflects actual material mix and disposal route | Needs proper waste segregation and volume tracking, often requiring cooperation from a waste vendor |
| Fuel-based | When actual fuel receipts or logs are available | More accurate than distance-based, reflects real consumption, and pairs with well-established fuel emission factors | Requires fuel purchase or consumption documentation that most employees and transport suppliers may not routinely track |
| Distance-based | Transportation, business travel, employee commuting | Simple to calculate from booking systems or trip logs | Less precise than fuel-based, since it relies on assumed vehicle efficiency instead of actual consumption |
FAQs on Scope 3 Emissions in Singapore
Start with suppliers with the most spend or volume in a given category, and ask for activity data (weight, distance, energy use), which is easier to hand over than a finished carbon figure. If a supplier still cannot provide anything, the fallback will be a secondary emission factor for that category, flagging it as an estimate.
2. Is it acceptable to use estimated data instead of actual supplier figures?
Yes, and most companies report this way, especially in the first year. At the start, reporting companies may provide a mix of primary and estimated data. What matters more is disclosing which method was used for which category and showing the estimated share shrinking as refined supplier data becomes available.
3. Are small- to medium-sized suppliers required to report their own scope 3 emissions?
Under SGX’s rules, SME suppliers that are not considered an SGX-listed issuer are still not directly covered by the mandate. In practice, more of them are being pulled into the process as their SGX-listed customers and clients now need activity data from them to calculate scope 3, especially category 1 and category 4 emissions.
Close the Scope 3 Gap with Presgo ESG Technology
Singapore companies need to shift from manual and unreliable data management practices to advanced ESG technology and expert guidance. Both of these qualities are in Presgo.
An AI-first ESG reporting software, Presgo is an enterprise-grade platform guided by ESG analysts and specialists. The software is equipped with modular reporting solutions, including its carbon calculator and disclosure hub aligned with ISSB, SGX, GHG Protocol, and several other frameworks and standards.
Presgo is PSG-eligible and is a listed reporting solution vendor in the Singapore-funded grant.
Book a demo today and optimise your supply chain data management and scope 3 reporting.