

Talk to an ESG Expert about how Presgo can help you!
Our ESG Experts are on-hand to understand your ESG Reporting needs and cater our solution to you. Get in touch to discuss how we can help.
Talk to an ESG ExpertContents
- What is NSRF’s IFRS S2 standard?
- What is scenario analysis for climate risk under IFRS S2?
- What is the proportionality mechanism under IFRS S2?
- Why is scenario analysis important for Malaysian companies?
- What are the steps to conduct scenario analysis?
- Where can scenario analysis be applied?
- Scenario Analysis Challenges for Malaysian Companies and How to Address Them
- FAQs on IFRS S2 Scenario Analysis
- Build IFRS S2 Scenario Analysis Readiness with Presgo
The rollout of the mandated National Sustainability Reporting Framework (NSRF) has been pushing Malaysian companies to refine their sustainability targets. Along their compliance journey, these Malaysian companies also face this regulatory question: What can businesses actually do if the world misses its climate targets? The IFRS S2 standard under the NSRF addresses this through climate scenario analysis.
What is NSRF’s IFRS S2 standard?
IFRS S2 is the International Financial Reporting Standards, or IFRS sustainability disclosure standard, for disclosing climate-related information on risks and opportunities. It was released by the International Sustainability Standards Board (ISSB) in June 2023 along with IFRS S1 for general sustainability requirements. It sets out what a company must disclose about the current and anticipated effects of climate change on its business model, strategy, and cash flows.
Malaysia adopted both standards as the backbone of its NSRF mandate; Malaysia now requires listed and large non-listed companies to align with ISSB’s sustainability disclosure standards.
Who reports under NSRF?
Using a phased implementation from FY2025, NSRF applies to Main Market, ACE Market, and large non-listed companies, with each group following a timeline.
Group 1
Group 1 covers Main Market issuers with a market capitalisation of RM2 billion and above. IFRS S2 starts in FY2025, IFRS S1 follows in FY2026, and scope 3 emissions reporting begins in FY2027.
Group 2
Group 2 covers the remaining Main Market issuers. Each layer lands a year behind Group 1 – IFRS S2 in FY2026, IFRS S1 in FY2027, and scope 3 in FY2028.
Group 3
Group 3 covers ACE Market issuers and large non-listed companies with annual revenue of RM2 billion and above. IFRS S2 starts in FY2027, IFRS S1 in FY2028, and scope 3 in FY2030.
Once a company knows which group it falls into, the real question becomes what the standard expects it to actually do, which starts with scenario analysis.
What is scenario analysis for climate risk under IFRS S2?
Scenario analysis is a way of testing a company’s strategy against several plausible futures. It matters under IFRS S2 because it captures climate change outcomes, which depend on the pace of global decarbonisation, enforced policies, and evolving physical hazards.
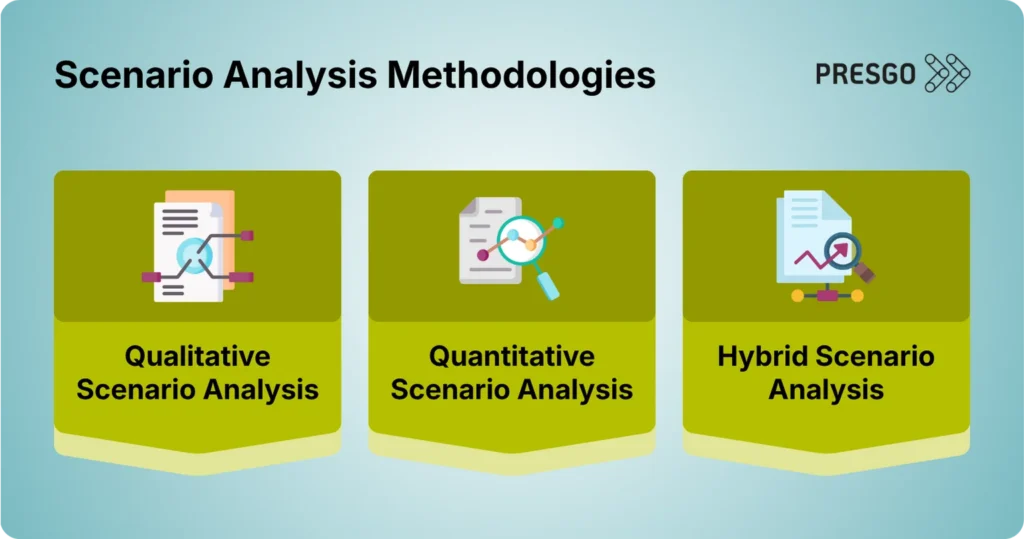
Climate resilience, or the capacity of a company to hold up against physical and transition risk, gets tested through one of three broad approaches, depending on what the company can realistically support:
- Qualitative scenario analysis is a narrative description of plausible futures, without modelled figures. It suits companies without deep data infrastructure or those running a first exercise.
- Quantitative scenario analysis translates a scenario’s assumptions, such as carbon price, temperature pathway, or policy timing, into financial outputs like revenue impact, asset write-downs, or credit loss changes.
- Hybrid scenario analysis quantifies emissions-intensive segments while describing harder-to-model exposures, such as reputational risk, in narrative form.
None of these is mandated outright. IFRS S2, and the NSRF that adopts it, leave the choice to a mechanism built specifically for that flexibility.
What is the proportionality mechanism under IFRS S2?
The proportionality mechanism is built to let a company disclose what it can support now and be upfront about what it can’t. It helps avoid the possibility of a company skipping scenario analysis altogether or forcing a disclosure that can’t be backed with data.
As a practice, companies select an approach that fits their size, exposure, skills, and data available to them. A large listed bank might run quantitative modelling across several pathways, while a mid-sized manufacturer might run a qualitative, narrative-based exercise for its first attempt. Both comply with the requirement, provided the companies use all reasonable and supportable information available, unless the process incurs excessive costs and effort.
Malaysia’s national electricity utility, Tenega Nasional Berhad (TNB), under Group 1, shows in its FY 2025 sustainability report that it mapped its climate disclosures directly against IFRS S2 guidelines. TNB completed a physical risk scenario analysis, covering flood, storm, heatwave, and lightning exposure to its grid and generation assets. However, it left the transition risk scenario analysis out of the same report, stating plainly that the methodology is still being developed and will follow in a future reporting period.
Why is scenario analysis important for Malaysian companies?
Malaysia lies directly in the path of monsoon flooding. Since 2000, these floods have caused 85% of the country’s natural disasters, according to a joint report by the World Bank Group and Bank Negara Malaysia. They estimated that 44% of total potential flood-related losses would occur in the services sector, accounting for a large share of the banking system’s loan portfolio.
The Securities Commission Malaysia (SC) responded to sustainability impacts by launching the NSRF in September 2024. Along with the climate effects, there are several issues that scenario analysis can address and benefits it can provide.
Provides a view of a company’s risk exposure
Scenario analysis exposes a concentrated risk before an event. A simple view of a balance sheet doesn’t reveal which specific assets or regions carry particularly high climate exposure. The climate scenario analysis gives the utility an asset-level view of its vulnerabilities years before any single event materialises the issues.
Guides sustainability strategies
Scenario analysis gives management a tested view of strategies, targeting plausible risks and transitions before the actual conditions happen. For instance, Sime Darby Property reported in 2024 that they ran three Intergovernmental Panel on Climate Change (IPCC)-aligned pathways for 2030 and 2050. The real estate company’s scenario analysis findings were used to assess possible costs and opportunities from specific assets in its portfolio. The data feeds into its climate risk management as part of its overall short- and long-term climate strategy.
Supports defensible decision-making
Scenario analysis turns climate exposure into financing decisions a board can defend. Commerce International Merchant Bankers, or CIMB, used scenario-based analysis, drawing on the International Energy Agency’s net zero emissions pathways. The Malaysian banking group used scenario analysis to set credible and supported 2030 decarbonisation targets for its lending portfolios, particularly in oil and gas and real estate.
Helps in capability-building
Scenario analysis builds internal capability before the deadline. Groups 2 and 3 companies still have one to two years before their own IFRS S2 clock starts. Maybank’s M25+ strategy already weaves climate risk through group-wide planning years ahead of when smaller issuers will need to. This strategy is simply what an early scenario analysis exercise builds.
What are the steps to conduct scenario analysis?
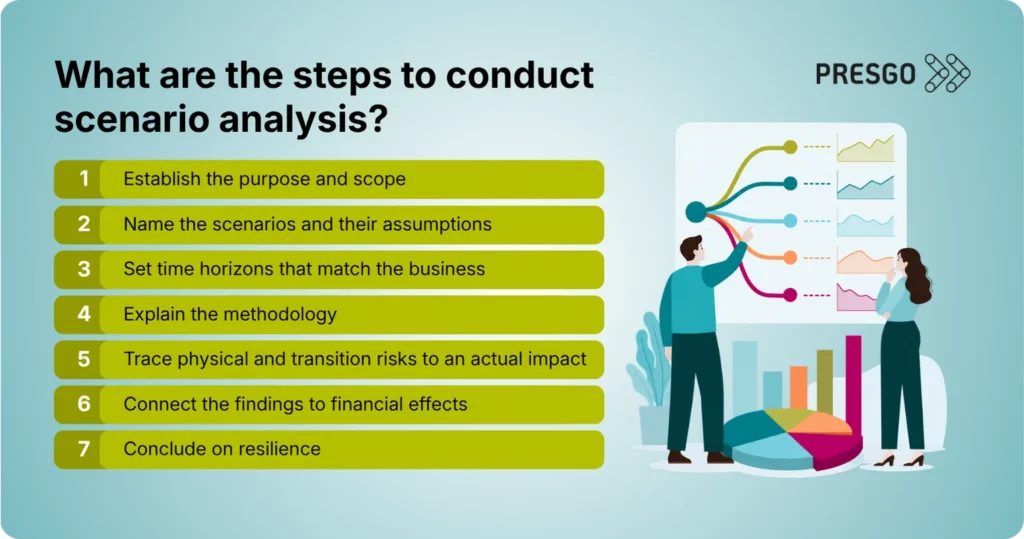
A practical disclosure sequence looks like this, moving from scope to conclusion:
1. Establish the purpose and scope
Explain why the exercise was run and which parts of the business it covers, plus which assets, markets, or subsidiaries were left out and why.
2. Name the scenarios and their assumptions
Identify the pathways used, such as an orderly transition, a delayed one, or a high-warming outcome. Summarise what sits behind them, such as carbon price, energy costs, policy shifts, and demand changes.
3. Set time horizons that match the business
Define short-, medium-, and long-term planning cycles, financing terms, or asset lives, rather than borrowing from another company’s periods.
4. Explain the methodology
State whether the work was qualitative, quantitative, or a mix, which data fed into it, which assets or locations it covered, and where the gaps sit.
5. Trace physical and transition risks to an actual impact
Rather than naming flooding as a risk in the abstract, describe the pathway: heavier rainfall raising flood exposure around a specific facility, disrupting production and delaying deliveries.
6. Connect the findings to financial effects
Link scenario output to revenue, costs, asset values, or financing terms where possible, and explain plainly where quantification isn’t ready yet.
7. Conclude on resilience
State where the business holds up, where it doesn’t, and what happens next. A report that claims full resilience with no caveats is a bigger red flag than one that shows some gaps.
Where can scenario analysis be applied?
Scenario output rarely stays inside the sustainability report. It typically feeds decisions in at least four other places:
Credit and Lending Policy
Banks use scenario findings to reprice or restructure exposure to carbon-heavy sectors. CIMB’s 2030 decarbonisation targets for its oil and gas and real estate portfolios are a direct result of this kind of analysis.
Capital and Financing Allocation
Group-level strategy teams use scenario output to decide where green financing needs to be concentrated. Maybank’s M25+ strategy incorporates climate scenario findings directly into where group capital gets deployed.
Asset and Infrastructure Investment
Utilities and infrastructure operators use physical risk outputs to prioritise their capital investments. In TNB’s 2025 report, the scenario findings on flood, heatwave, and lightning exposure risks were used to decide which of their grids and generation assets need urgent reinforcement.
Project and Portfolio Sequencing
Property developers use scenario output to decide which projects proceed under which assumptions. Sime Darby Property tested three warming pathways across its townships specifically to see which developments carry outsized long-term exposure before committing further capital.
Scenario Analysis Challenges for Malaysian Companies and How to Address Them
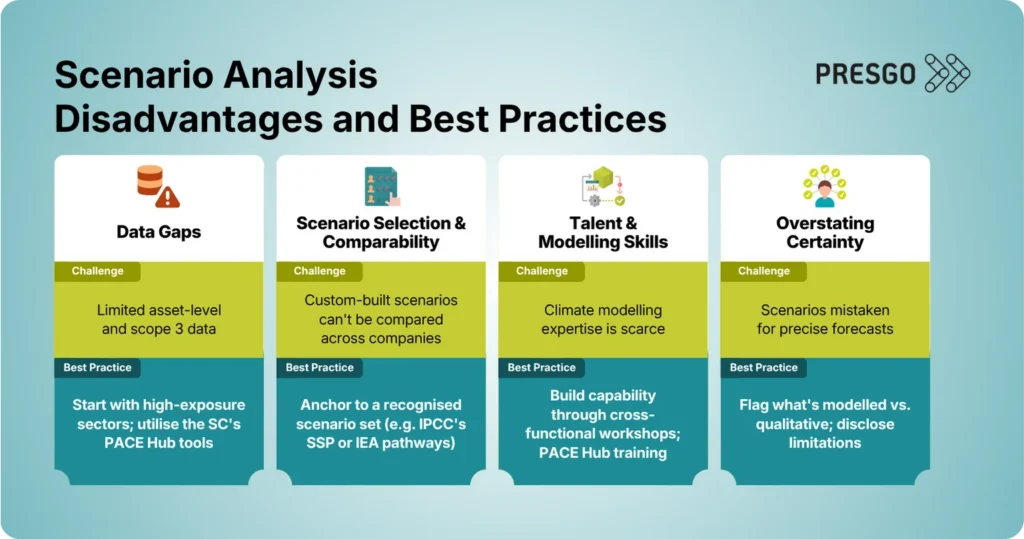
While scenario analysis benefits companies, some problems come up, especially for Malaysian companies that attempt this for the first time. Here are the recognised challenges with scenario analysis, examples, and best practices from Malaysian companies.
Data Gaps
Challenge: Malaysian companies typically lack granular, asset-level physical risk data and reliable scope 3 numbers for use in a model.
Best practice: Start with the sectors and geographies where exposure concentrates, instead of the whole portfolio. Companies can draw on the SC’s PACE Hub for standardised emissions assumptions and calculators, rather than building every input from scratch.
Example: TNB began with asset-level physical risk coverage across its grid and generation fleet before attempting transition risk work. It sequenced its start instead of attempting to model everything at once.
Scenario Selection and Comparability
Challenge: Companies that pick custom-built scenarios end up with results that they cannot measure against each other. Investors also tend to care more about how sensitive a company is to a given carbon price or policy delay than which named scenario produced the number.
Best practice: Anchor to a recognised external scenario set, such as the IPCC’s SSP pathways or the IEA’s for short- and long-term scenario frameworks. This exposes the plausible risks and opportunities for disclosure and strategy.
Example: Sime Darby Property adopted SSP pathways directly, keeping its results legible against peer comparison. CIMB took the same approach with its lending targets, building them on IEA’s pathways.
Talent and Modelling Skills
Challenge: Specialist climate modelling skills remain scarce, and finance teams that already manage IFRS reporting rarely have spare capacity.
Best practice: Build capability in stages rather than all at once. Cross-functional workshops that pull in finance, risk, and sustainability teams, paired with the PACE Hub resources and training programmes, help close that gap.
Example: Maybank’s M25+ strategy optimised climate risk through group-wide planning, avoiding the isolation of sustainability functions and responsibilities.
Overstating Certainty
Challenge: Scenarios are not considered precise forecasts. Treating modelled output this way, or declaring a strategy fully resilient and dependent on this risk, misleads the exact disclosure it is meant to inform.
Best practice: State plainly which figures are modelled and which are qualitative judgements. Material limitations should be flagged, and conclusions be allowed to hold both what is working and what is not.
Example: TNB stated outright that its transition work methodology is still being developed, which is the more credible approach even though it reads as a cap on paper.
FAQs on IFRS S2 Scenario Analysis
1. Do companies need to update their scenario analysis every year?
No. IFRS S2 requires annual climate risk reassessment, but the climate scenario analysis behind it only needs updating in line with the company’s strategic planning cycle, or whenever circumstances change significantly.
2. Does IFRS S2 require a specific scenario set?
No. IFRS S2 doesn’t mandate any particular external scenario. Companies choose pathways that fit their exposure, provided that they disclose the assumptions clearly.
3. How is the scenario analysis different from a materiality assessment?
A materiality assessment focuses on which sustainability topics matter for reporting. Scenario analysis comes after that process, testing how resilient the company’s strategy is against several plausible futures for the risks flagged as material by the materiality assessment.
Build IFRS S2 Scenario Analysis Readiness with Presgo
Preparing for IFRS S2 compliance and optimising scenario analysis are the first steps to building long-term strategic growth and resilience in Malaysia and globally. Data pipelines, scenario selection, and internal modelling can take longer to build than expected. With ESG reporting software, like Presgo, IFRS compliance and sustainability best practices will not be too hard to achieve.
Presgo is an AI-first, modular ESG software built for IFRS S2 climate-related disclosures and data and analytics. The platform, supported by ESG experts, offers sustainability solutions for IFRS compliance and reporting. Presgo’s goals and performance module already handles the quantitative half, tracking current performance against a company’s targets and projecting how those targets will be met over time. The materiality assessment module covers the qualitative narrative, identifying and weighing the sustainability and climate risks and opportunities behind those targets, the same inputs a scenario exercise runs on. Presgo’s disclosure hub then maps whatever comes out of all of it against IFRS S1 and S2’s actual requirements.
Book a demo today to see how Presgo can support your company’s climate scenario analysis and disclosure ahead of the NSRF’s next reporting phase.